

Diesel’s Up, Down, and Sideways: Part 2
October 29, 2026
Trucking Congestion, Part 2: No Quick Fixes
November 20, 2026Trucking Congestion, Part 1: The $128 Billion Traffic Jam
The Real Cost of Trucking Congestion
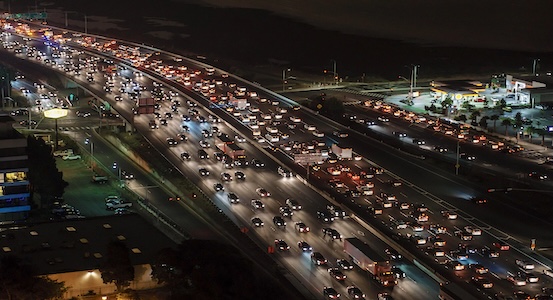
Congestion cost the trucking industry $128.2 billion in 2024, and every hour in traffic adds to the bill.
Anyone who has moved freight through a major metro knows the feeling. The load is ready, the truck is ready, and then the road isn’t. The cost of trucking congestion goes beyond frustration on the dashboard. It’s a line item, and it keeps growing.
The American Transportation Research Institute’s newest Cost of Congestion update puts the price at $128.2 billion in 2024, the latest year studied. That’s 28.8% above the 2018 pre-pandemic peak.
Behind that number are 1.24 billion hours of delay, the equivalent of more than 451,000 commercial drivers sitting idle for a full working year. Trucks stuck in traffic also burned about 6.66 billion gallons of diesel.
The full report is free to download, with registration, from ATRI.
Where does it hurt most? Texas, California, and Florida each topped $10 billion in congestion costs. The New York City metro led the country at $7.49 billion. Average truck speeds in key congested corridors slipped to about 52 mph.
Part of the problem is volume. More people and more commerce put more cars and trucks in the same lanes. The other part is the lanes themselves. In its most recent Report Card for America’s Infrastructure, the American Society of Civil Engineers gave U.S. roads a D+ and bridges a C. Both grades are better than before, but a lot of pavement, overpasses, and tunnels still need work, and that work brings its own lane closures and detours.
For flatbed, oversize, and heavy haul freight, the squeeze is even tighter. A detour that costs a dry van an hour can cost an oversize load a permit change, a new route survey, or a missed travel window.
So, congestion is expensive, it’s growing, and the roads that carry our freight are showing their age. That leaves an obvious question: can anything be done, and how fast?
Stay tuned. In Part 2, coming next week, we’ll look at why easing congestion takes time and strategy, and what that means for anyone moving freight in the meantime.