

Logistics Updates
August 23, 2023
The NATCO Differential, Part I
September 8, 2023By Way of Highways

On the Move
By experience and by statistics, this country is on the move.
Remember back to the beginning of the pandemic: as we hunkered down, not knowing what was going to happen, the roads got eerily quieter. And pollution levels receded. And we watched a lot more television.
It’s too early to know for sure ⏤ and maybe we’ll never know; things change all the time ⏤ but it does look like we’re moving through and past that lull, in robust ways.
One way to try gauging it is through the U.S. Department of Transportation’s monthly report, Traffic Volume Trends.
The DOT’s most recent report takes us up through June of 2023. A couple of examples:
-
“Travel on all roads and streets changed by +3.1% (+8.4 billion vehicle miles) for June 2023 as compared with June 2022.”
-
“Cumulative Travel for 2023 changed by +2.3% (+35.1 billion vehicle miles). The cumulative estimate for the year is 1,578.9 billion vehicle miles of travel.”
The statistics on Average Daily Travel on U.S. Highways by Month:
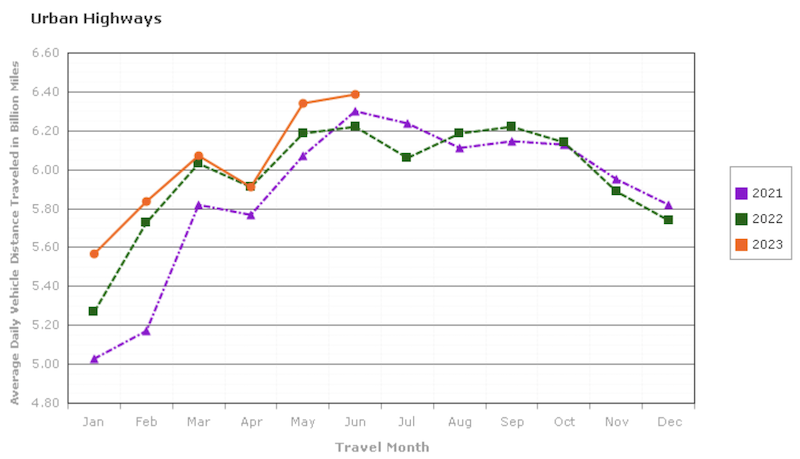
U.S. DOT
The easy and fairly safe guess from this chart is that we tend to drive more in the warmer months. And while that might seem otherwise unimportant, factor in some variables ⏤ like supply-and-demand, scheduling infrastructure projects, and gas prices ⏤ and we can also catch hints of how statistics inform planning and action.
How dramatic were the effects of the pandemic on the economy and on how we lived? Have a look at the DOT’s graph of Seasonally Adjusted Vehicle Miles Traveled by Month:

U.S. DOT