

The Basics
May 3, 2024
Essential Q & A
May 17, 2024
By the Numbers
We face many challenges in the U.S. trucking industry, Things like driver retention, alternative fuel adaptation, and supply-and-demand fluctuations make for an (as-always) uncertain future. That said, we’re proud to be part of and contribute to such a vital industry. Among the sometimes eye-opening statistics:

Our Statistical Watchdog
8.4 million
→ number of people who are employed in trucking-related industry work.
72.6
→ percent of all goods moved throughout the United States by truckers.
82.7
→ percent of all agricultural products moved throughout the United States by truckers.
92
→ percent of all dairy, fruit, nuts, and vegetables moved throughout the United States by truckers.
$940 billion
→ gross freight revenue from trucking.
100,000
→ miles on average driven by a truck driver each year.
13.8 million
→ number of trucks on our roads.
45.6
→ percent of drivers who are minorities.
12.1
→ percent of drivers who are women.
64.4
→ percent of trucks with lower emissions than a decade ago.
1.3 trillion
→ dollars in revenue the industry is projected to generate by the end of the year.
10
→ percent of trucks on the road driven by owner-operators.
2nd
→ rank of lack of available truck parking as a concern of truckers.
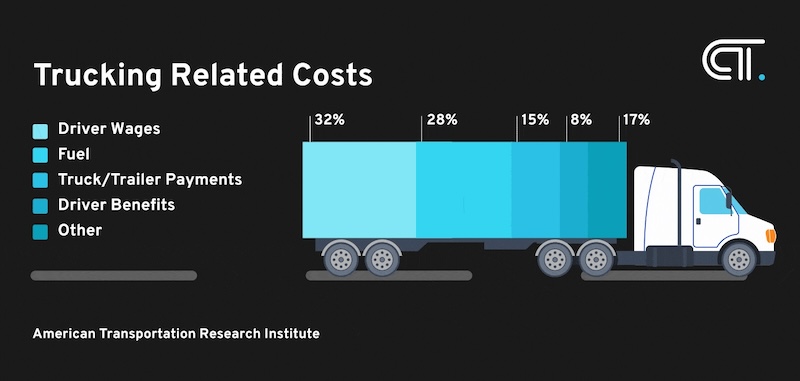
28
→ percent of all costs of trucking-related expenses.
90
→ percent of NATCO’s customers who are repeat business.
50
→ number of States that have been served by NATCO.
graphic by CloudTrucks