

Driver Supply and Demand
November 30, 2021
Supply Chain Strain
December 17, 2021
Statistically . . . Impressive.

By the Numbers
Numbers are numbers. They’re not things, and things are what this nation produces and buys.
The thing is, we make and consume those things in huge numbers. And so, this week we give you a grab-bag collection of statistics of the U.S. trucking industry:
- In 2019, trucking moved about 70% of all consumer goods, with a revenue of $791 billion.
- The trucking industry represents about six percent of U.S. employment.
- In April of 2020, there were nearly 800,000 registered private carriers. That said, our shortage of truck drivers could reach 160,000 by 2028.
- In 2019, truck drivers moved nearly 12 billion tons of freight.
- Some 6.7 percent of U.S. truck drivers are female.
- The average wage for those in the transportation industry is $26.30 an hour.
- Projection: more than 50 percent of small fleets will be entirely autonomous by 2040.
- One study found self-driving trucks to be 10% more fuel efficient than traditional trucks.
- Commercial vehicles contributes more than $48 billion to federal and state highway taxes in 2019.
- Commercial trucks comprise more than 14 percent of all registered vehicles. That totals nearly 38 million trucks.
- Those trucks traveled just over 300 billion miles in 2019.
That money for our nation’s infrastructure can’t come soon enough for us to begin work on repair and replacement. Take the state of our bridges, for example:
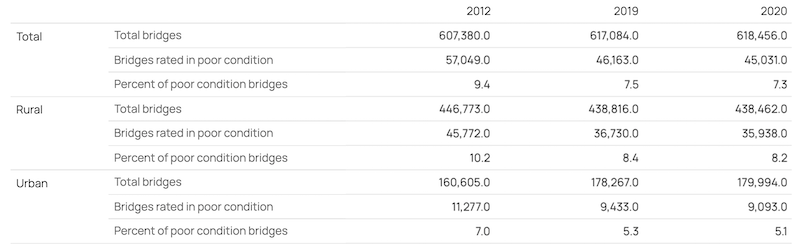
Troubled Bridges
We had 1,372 more bridges in 2020 than we did in 2019.
In 2020 we had 45,031 bridges in poor condition. That’s 1,132 fewer than in 2019. Which is progress, though our carriers and everyone in the industry knows all too well how even a single bridge detour can require reworking an entire route.
Here’s to a safe holiday season.