

Women in Transportation
October 27, 2023
Parking It in All 50
November 10, 2023
Thinking of Rolling Ahead
Statistically Speaking
The U.S. Department of Transportation’s annual Pocket Guide to Transportation has a number of fascinating stats on the past, present, and projected future of our industry.
The guide’s introduction to the Moving Goods section: “The freight transportation network links natural resources, manufacturing facilities, labor markets, and customers across the nation and with international trading partners.”
Those links are where it’s at. As in: how do we get our freight shipped domestically?
The majority is via truck. Of the $18 trillion in shipment value in 2020, freight by truck accounted for $13 trillion of that. 2050’s projections: $36 trillion total, $26 trillion by truck.
(Other modes include: Rail, Water, Air and truck-air, Pipeline, and Multiple modes.)
The weight of those shipments? Of the 19 billion pounds moved in 2020, 12 billion pounds of that was on trucks. 2050’s projections: 28 billion pounds total, 19 billion pounds by truck. Weight matters. A lot.
A good deal of highway and street maintenance involves pothole-filling and general degradation, and the weight of our vehicles, along with temperature fluctuations and weather, contributes to the need for maintenance. That’s part of the reason why infrastructure spending is so important.
Here’s the guide’s employment statistics for our industry:
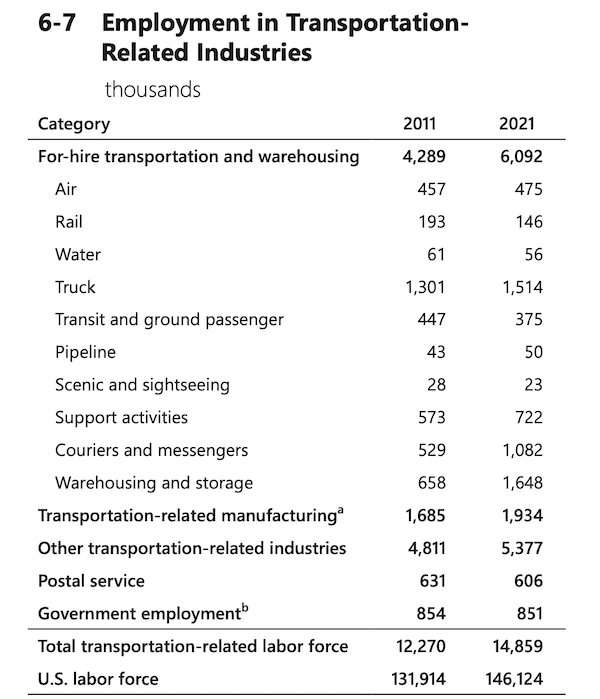
As we’re reading it, transportation-related employment in the United States accounts for some 10 percent of the entire labor force.
All that movement happens on 4 million miles of public roads, 1.3 million miles of pipeline, 92,000 miles of freight rail, 25,000 miles of navigable waterways, 618,456 bridges, 1,057 heavy rail stations, 192 ports, and 8,334 cargo handling docks.
Want more insight on how our economy moves? Check out the Bureau of Labor Statistics website HERE.