Human Ingenuity
August 1, 2017
Eclipsing Transportation
August 15, 2017Real Time & Projections Throughout the Industry.
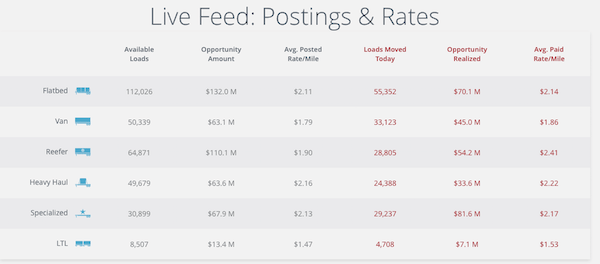
Our friends at Truckstop.com maintain a fascinating chart on their home page. Their live feed of postings and rates shows available loads for six types of freight movement, along with total opportunity amounts and average pay rates per mile.

from Truckstop.com
(We took this snippet at 10 o’clock on Monday morning, August 8th. The live feed no doubt has changed since then.)
It provides quite a valuable tool for 3PL businesses like ours, allowing us to evaluate, say, a heavy haul movement—one of our specialties—in order to remain competitive in the industry and fair to our carriers.
What’s remarkable is that this reflects a snapshot of one moment from one company that aggregates such statistics. From the American Trucking Associations, here are some additional statistics:
- Trucks account for more than 70% of all freight movement in the United States.
- We move some 10.5 billion tons of freight each year.
- More than 3.5 million carriers move this freight on more than 3.4 million heavy-duty Class 8 trucks.
- This annual movement requires more than 38 billion gallons of diesel fuel.
- Freight volumes projected to grow 2.8% this year.
- Freight volumes projected to grow 3.4% each year from 2018 through 2023.
- 73 billion tons of freight projected to move in 2028.

NATCO: Watching Business Trends
Another possible contribution to such healthy projections are the prospects of deregulation (though we know from experience that regulations and the reversal of them do take time).
All of this is good for the industry, good for the economy, good for employment.
And so, we keep a watchful eye on trends in freight transportation and the disruptors that can create ripples of positive and negative change throughout the industry. Hydrogen fuel, self-driving vehicles, Hyperloop development: all can have major impact. Stay tuned.

