

Infrastructure Spending Sources
January 16, 2019
Combatting Congestion
February 6, 2019NATCO Covers the Nation
NATCO: Across the Nation
Some statistics can be manipulated. In polling, a lot depends on how we ask the question.
When it comes to NATCO and our delivery history, the numbers are transparent.
Case in point: the most recent update to Our Trucking Network, which now includes our delivery history for 2018.
As you’ll see with our plotted markers, it was a busy year for Team NATCO. (And as our business is a microcosm of the nation’s business in general, it was a busy and healthy year for the U.S. economy across most every sector.)
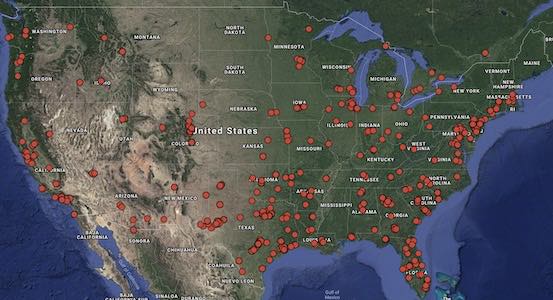
So, if the numbers don’t lie, what can we make of all those dots on a map?
Well, many things. First of all, know that these dots represent our delivery destinations. We design all of our annual maps this way in order to keep our clients’ information confidential. With that, the cities are accurate, not the exact latitude and longitude coordinates. (It also helps the eye see clusters of deliveries better without those dots overlapping too much.)
The overall picture reveals very active concentrations in a number of regions. Northern and Southern California, Florida, the Carolinas, the I-95 corridor, the Chicago area, pretty much all of Texas (especially the Dallas-Fort Worth area): all are well-represented by NATCO-coordinated deliveries for the year.
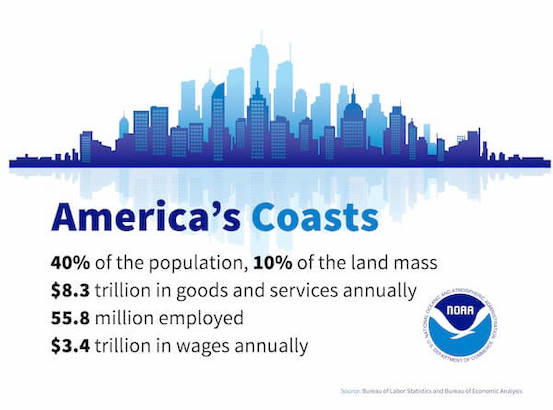
NATCO on our Coasts
Some 40 percent of the U.S. population (more than 126 million people) lives in counties touching the coast. (Fun fact: the nation’s coast represents less than 10 percent of our land.) That represents some 56 million jobs, producing more than $8.3 trillion in goods and services.
If our coastlines were a country, they would be third in GDP, just behind the United States itself and China. In that light, coastal deliveries make perfect sense. Cumulatively, our maps may provide an approximate indicator of each state’s relative economic health. (We know: just because NATCO didn’t deliver to South Dakota last year doesn’t mean that state’s economy is in the tank.)
Clicking on any given marker will also show you the miles driven to reach the off-load point. Our shortest delivery last year? To Charlotte, NC (7 miles). Our longest? To Martinez, CA (3,133 miles).
Each dot on our map has a story to tell. And while it’s impressive to see the sheer volume, that’s not the real story. Our VP Cori Eckley puts it best:
“I never measure my customers or the business by the number of loads we do. I can move two—or ten, or fifteen, or 20—loads a day. My goal is to give an order to my team, and they make a couple of phone calls and discover who’s the best fit on any given day.”
For Team NATCO, quality will always best quantity.
And South Dakota, we hope to see you again this year.